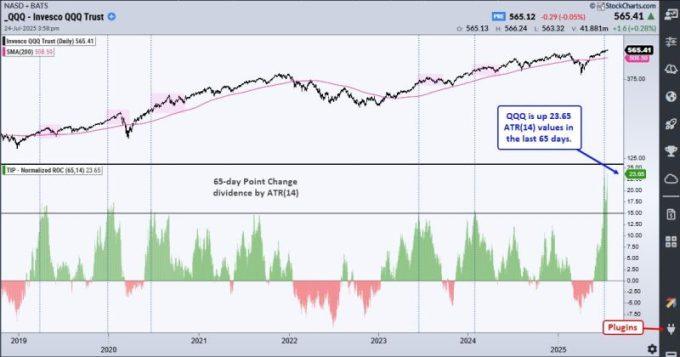
QQQ and tech ETFs are leading the surge off the April low, but there is another group leading year-to-date. Year-to-date performance is important because it includes two big events: the stock market decline from mid February to early April and the steep surge into early June. We need to combine these two events for a complete performance picture.
TrendInvestorPro uses a Core ETF ChartList to track performance and rank momentum. This list includes 59 equity ETFs, 4 bond ETFs, 9 commodity ETFs and 2 crypto ETFs. The image below shows the top 10 performers year-to-date (%Chg). Seven of the top ten are metals-related ETFs. Gold Miners (GDX), Silver Miners (SIL), Platinum (PLTM) and Gold (GLD) are leading the way. The Aerospace & Defense ETF (ITA), Transformational Data Sharing ETF (BLOK) and ARK Fintech Innovation ETF (ARKF) are the only three non-commodity leaders. The message here is clear: metals are leading.
********************
Subscribe to TrendInvestorPro and get these four bonuses:
- Adding and Testing an Exit Strategy for the Zweig Breadth Thrust
- The Bottoming Sequence: Capitulation, V Reversals, Thrusts and Bull Market
- 200-day Cross for SPY/QQQ: Improve Performance with Smoothing, Filters and a Twist
- Core ETF ChartList (59 equity ETFs, 4 bond ETFs, 9 commodity ETFs, 2 crypto ETFs)
Click here to take a trial and gain full access
********************
TrendInvestorPro has been tracking the Platinum ETF (PLTM) and Palladium ETF (PALL) since their big breakout surges on May 20th. The chart below shows PALL with a higher low from August to April and a breakout on May 20th. The ETF fell back below the 200-day SMA (gray line) in late May, but resumed its breakout with a 7.75% surge this week.
The bottom window shows the PPO(5,200,0) moving above +1% on May 21st to signal an uptrend in late May. This signal filter means the 5-day EMA is more than 1% above the 200-day EMA. The uptrend signal remains valid until a cross below -1% (pink line). As with all trend-following signals, there are bad signals (whipsaws) and good signals (extended trends). Given overall strength in metals, this could be a good signal that foreshadows an extended uptrend.
TrendInvestorPro is following this signal, as well as breakouts in other commodity-related ETFs. Our comprehensive reports and videos focus on the leaders. This week we covered flags and pennants in several tech ETFs (XLK, IGV, SMH, ARKF, AIQ, MAGS). Click there to take a trial and get your four bonuses.
/////////////////////////////////


