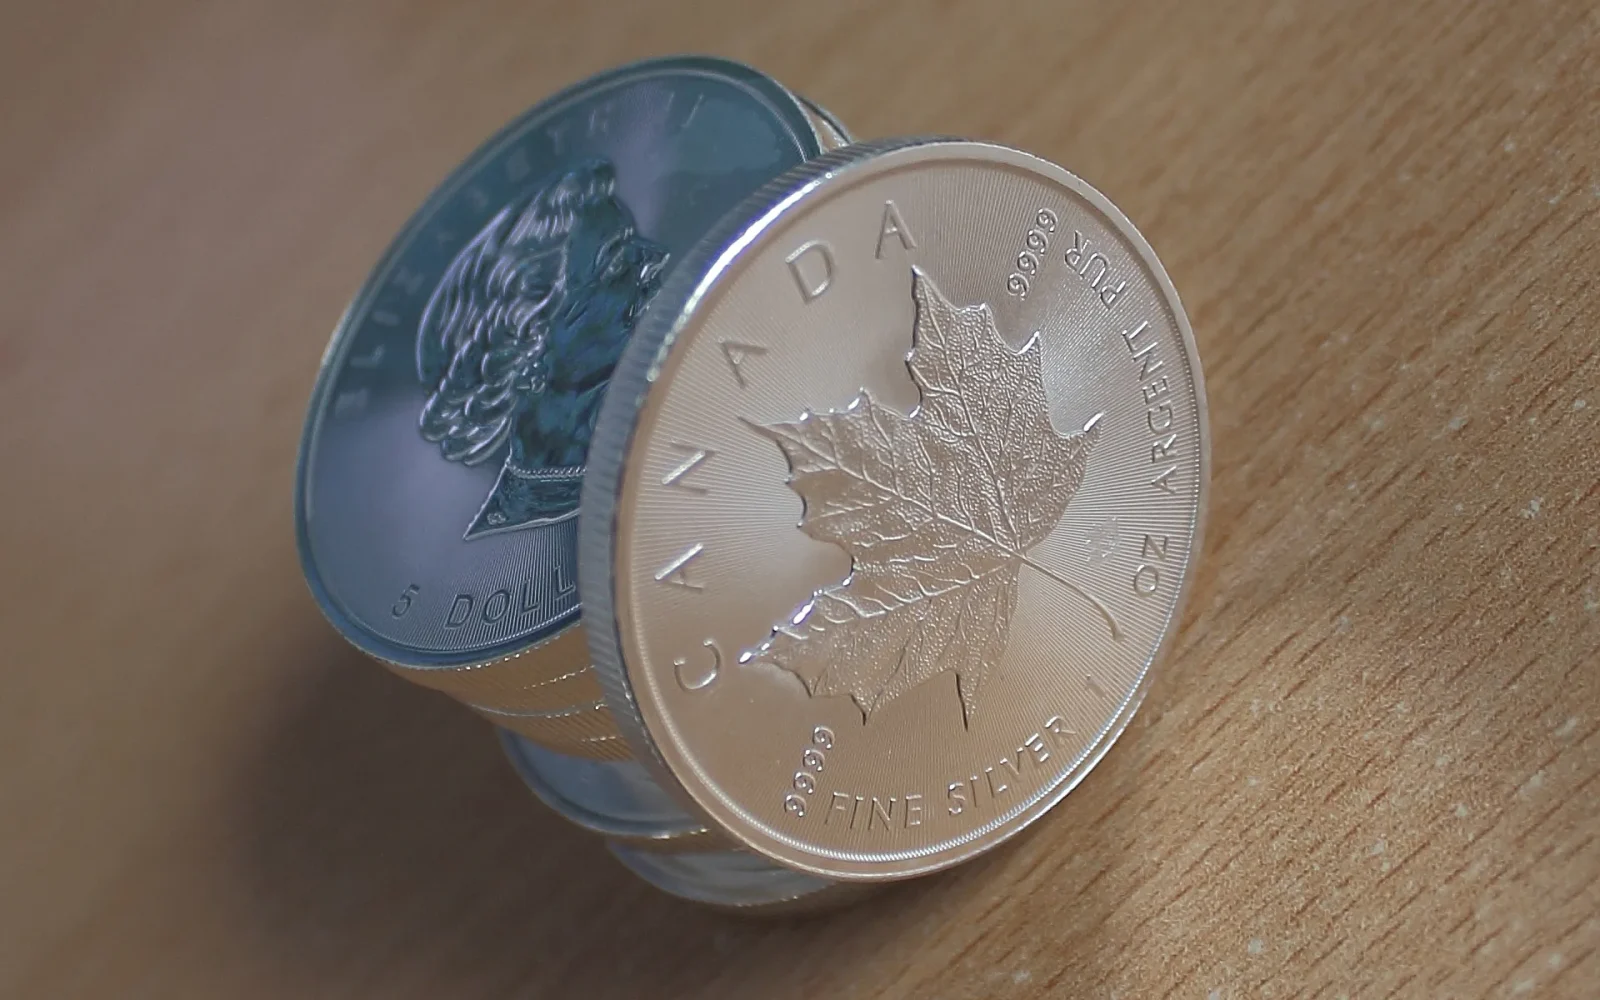
Silver is holding close to $66 an ounce while gold continues to struggle below $4,400, keeping the gold-silver ratio near its narrowest levels of the past week even after the Federal Reserve’s first interest-rate increase since 2023.
At 12:10 p.m. ET on September 22, spot silver was trading at $65.68 an ounce, down 0.5% on the day, while spot gold was down 0.4% at $4,325.03, according to Reuters. Those prices put the gold-silver ratio at about 65.85.
That is only slightly wider than Monday’s reading. USAGOLD had silver at $66.22 and gold at $4,353.31 on September 21, producing a ratio of 65.74. In other words, gold has lost more ground than silver over the past several sessions, leaving the relative-price gap between the two metals compressed even as both remain under pressure from tighter monetary policy.
Silver Price Holds Near $66 as Gold Stays Below $4,400
Monday had already established the pattern.
USAGOLD’s September 21 market report showed gold easing to $4,353.31 after failing to reclaim $4,400, while silver was almost unchanged at $66.22. Fortune separately quoted silver at $66.53 at 9:20 a.m. ET that day, down 0.61%, with gold at $4,362.66.
Tuesday’s move has extended rather than reversed that divergence. Gold slipped further to $4,325.03 by 12:10 p.m. ET, while silver remained within touching distance of $66.
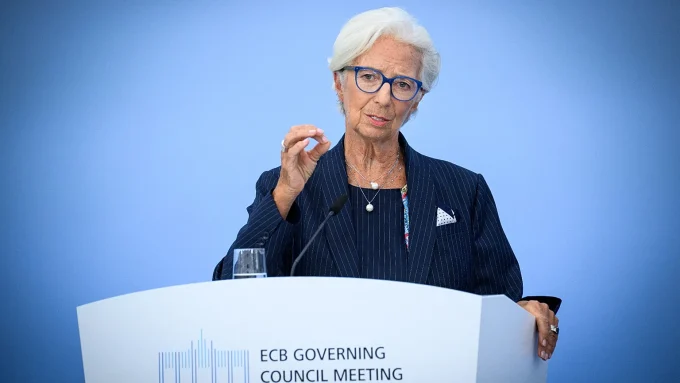
TD Securities global head of commodity strategy Bart Melek told Reuters that markets were continuing to price further Federal Reserve tightening while recent dollar strength was also working against gold.
The rate backdrop is important because neither gold nor silver pays interest. Higher yields increase the opportunity cost of holding both metals, while a stronger dollar can make dollar-denominated bullion more expensive for overseas buyers.
FinanceFeeds’ post-Fed silver price analysis showed how quickly that mechanism hit the market last week, when silver fell below $63 immediately after the rate decision before recovering sharply over the following sessions.
What the Gold-Silver Ratio Means – and Why 65.8 Matters
The gold-silver ratio measures how many ounces of silver are required to buy one ounce of gold. At a ratio of 65.8, one ounce of gold is worth roughly 65.8 ounces of silver.
A falling ratio means silver is outperforming gold on a relative basis. It does not necessarily mean silver itself is rising: the ratio can also fall when both metals decline but gold falls faster.
That is effectively what the market has been showing this week.
The ratio stood around 67 earlier in September. FinanceFeeds’ broader silver price scenario analysis has used the ratio as the central variable for measuring how far silver could move relative to gold, rather than assuming that the two metals always rise or fall together.
At today’s prices, the ratio remaining near 66 shows that silver has retained much of its relative strength despite the Fed’s return to tightening.
The 10-Year Treasury Yield Is Back Near 4.93%
The other important number is the bond market.
The Federal Reserve raised its target range by 25 basis points on September 16 to 3.75%-4.00%, effective September 17. It was the first Fed rate increase since July 2023.
The 10-year Treasury yield moved above 5% around the decision. U.S. Treasury data put the 10-year par yield at 5.01% on September 16 before it fell to 4.94% the following day. On Tuesday, market readings had the yield back around 4.93% as oil prices retreated.
That decline matters for precious metals because it reduces some of the yield pressure created by the Fed hike.
The response has not been uniform, however. Gold remains below where it traded immediately after last week’s rebound. FinanceFeeds reported on September 18 that gold had recovered to $4,394 as falling oil prices pulled Treasury yields lower. Tuesday’s $4,325 level shows that the recovery has since faded.
Silver has held up better relative to gold, which is why the ratio has remained compressed.
Silver Is Still About 51% Higher Than a Year Ago
The relative strength is also visible over a longer period.
Reuters quoted spot silver at $43.64 on September 22, 2025. At roughly $66 today, the silver price is about 51% higher year on year.
That gain has come despite several sharp corrections along the way. Silver traded above $100 earlier in 2026 before giving back a large part of that move, and its dual role as both a precious metal and an industrial input has produced greater volatility than gold.
That distinction matters when interpreting the ratio. Gold demand is heavily influenced by real yields, currencies, central-bank buying and safe-haven flows. Silver shares those drivers but also has industrial exposure to electronics, power infrastructure, solar manufacturing and other technology-intensive industries.
The ratio therefore compresses when silver’s additional demand channels allow it to outperform gold, but it can widen quickly when growth expectations weaken or investors move more aggressively toward gold as a defensive asset.
What Could Move the Gold-Silver Ratio Next?
The next move does not require a forecast. The variables are already visible.
If Treasury yields resume climbing and the dollar strengthens as traders price more Fed tightening, both metals face a higher opportunity cost. Reuters said Tuesday that markets were assigning a high probability to another rate increase before year-end, keeping that pressure alive.
If longer-term yields continue falling despite the Fed’s tighter policy rate, the drag on precious metals becomes less severe. The 10-year Treasury’s retreat from above 5% to around 4.93% is therefore an important counterweight to the Fed’s hawkish message.
The other variable is relative performance. Gold does not need to rally for the gold-silver ratio to fall. If silver simply loses less ground, as it has over the past several sessions, the ratio can continue to narrow.
For now, that is the clearest reading from the numbers: gold remains unable to reclaim $4,400, silver is still holding near $66, and the gold-silver ratio remains around 65.8 five trading days after the Fed returned to rate hikes.